
Le débogage de microcontrôleurs (MCU) a toujours été essentiel pour produire du code de haute qualité, mais la dépendance aux environnements de développement spécifiques aux fabricants et aux configurations complexes des serveurs de débogage peut parfois nuire à un flux de travail fluide.
Bien que VSCode ait révolutionné la façon dont les développeurs écrivent et déboguent du code, configurer une session de débogage pour les MCU peut parfois s’avérer difficile.
Heureusement, grâce à l’outil Zephyr west et à quelques extensions VSCode, mettre en place une session de débogage n’a jamais été aussi simple.
Dans cet article, nous allons configurer VSCode pour exécuter west debugserver, qui se charge de lancer un débogueur et de le connecter à l’IDE VSCode avec l’extension Cortex-Debug.
[L’introduction est en français, le reste du texte en anglais]
Prerequisites
For debugging Zephyr application through VSCode you’ll need to install the powerful Cortex-Debug extension. Also, the Zephyr SDK should be installed. Please follow the Getting Started Guide if you haven’t installed it.
Easy setup with West debugserver
The west debugserver command is very helpful to set up a minimal debug environment, as it run runners with the appropriate configuration for your board and can be used generically with any Zephyr supported board. The runners may be openocd, jlink, pyocd or others, depending on your board support.
With these two following steps, you will be able to run a debug session with VSCode:
- Create a task in your tasks.json file to run west debugserver.
- Create a launch.json file to configure Cortex-Debug.
For this example, we will use the STM32L562E_DK board as it supports west debugserver out of the box.
West debugserver task
The default runner of this board is pyocd, but an external package needs to be installed to use it. Due to this, we will set openocd as the runner, which is already installed with the Zephyr SDK. First, you have to create a VSCode task to run west debugserver in the background. In your tasks.json file, add the following task:
json
{
"label": "West Debugserver",
"type": "shell",
"command": "west",
"args": [
"debugserver",
"-r",
"openocd"
],
"problemMatcher": {
"pattern": {
"regexp":
"^(Info |Warn |Error):(.*)$",
"severity": 1,
"message": 2
},
"background": {
"activeOnStart": true,
"beginsPattern": "^Open On-Chip Debugger.*",
"endsPattern": ".*watchpoints.*",
},
},
"isBackground": true,
"runOptions": {
"instanceLimit": 1,
"instancePolicy": "terminateOldest"
},
"presentation": {
"reveal": "silent",
"close": true,
},
},
Some explanations about the configuration:
- args : The -r option specifies the runner to use, in this case, openocd.
- problemMatcher : This is used to parse the output of the west debugserver command and display it in the Problems panel. In our case, it matches the openocd output. If another runner is used, you may need to adjust the regex patterns.
- runOptions: As west debugserver opens a server, we don’t want to have port conflicts, so only one instance of the task can run at a time.
- presentation: This is used to control the output of the task in the terminal. In this case, we want to reveal the output silently and close it after the task is finished.
Now the task is ready to use. You can try to run it by pressing Ctrl+Shift+P, selecting the Tasks: Run Task command and selecting the West Debugserver or whatever label you have given to the task.
Another small task is needed to stop the west debugserver task when you are done debugging. Otherwise, it will keep running in the background. You can add the following task to your tasks.json file:
json
{
"label": "Stop Debugserver",
"type": "process",
"command": "${command:workbench.action.tasks.terminate}",
},
Here, the command will open an input box to select the task to terminate.
And that’s it for the tasks.json file!
Cortex-Debug configuration
The Cortex-Debug will now make the link between the debugserver and the VSCode debugging interface. To do this, you need to create a launch.json file in the .vscode directory of your project.
Add this configuration to your launch.json file:
json
{
"version": "0.2.0",
"configurations": [
{
"name": "Zephyr Debugging",
"executable": "${workspaceFolder}/build/zephyr/zephyr.elf",
"request": "launch",
"type": "cortex-debug",
"runToEntryPoint": "main",
"servertype": "external",
"gdbPath": "/opt/sdk-0.17.0/arm-zephyr-eabi/bin/arm-zephyr-eabi-gdb",
"gdbTarget": "localhost:3333",
"device": "STM32L562E_DK",
"preLaunchTask": "West Debugserver",
"postDebugTask": "Stop Debugserver"
}
]
}
Some explanations about the configuration:
- executable: This is the path to the ELF file generated by the Zephyr build system. By default, the build directory is build/zephyr/zephyr.elf, but you can change it if you have a different build directory.
- runToEntryPoint: This option specifies the entry point to run to when starting the debug session. In this case, it is set to main.
- gdbPath: The gdb path is set to the Zephyr SDK’s GDB executable.
- preLaunchTask and postDebugTask: these options specify the tasks we created just before. The name should be the same as task’s label.
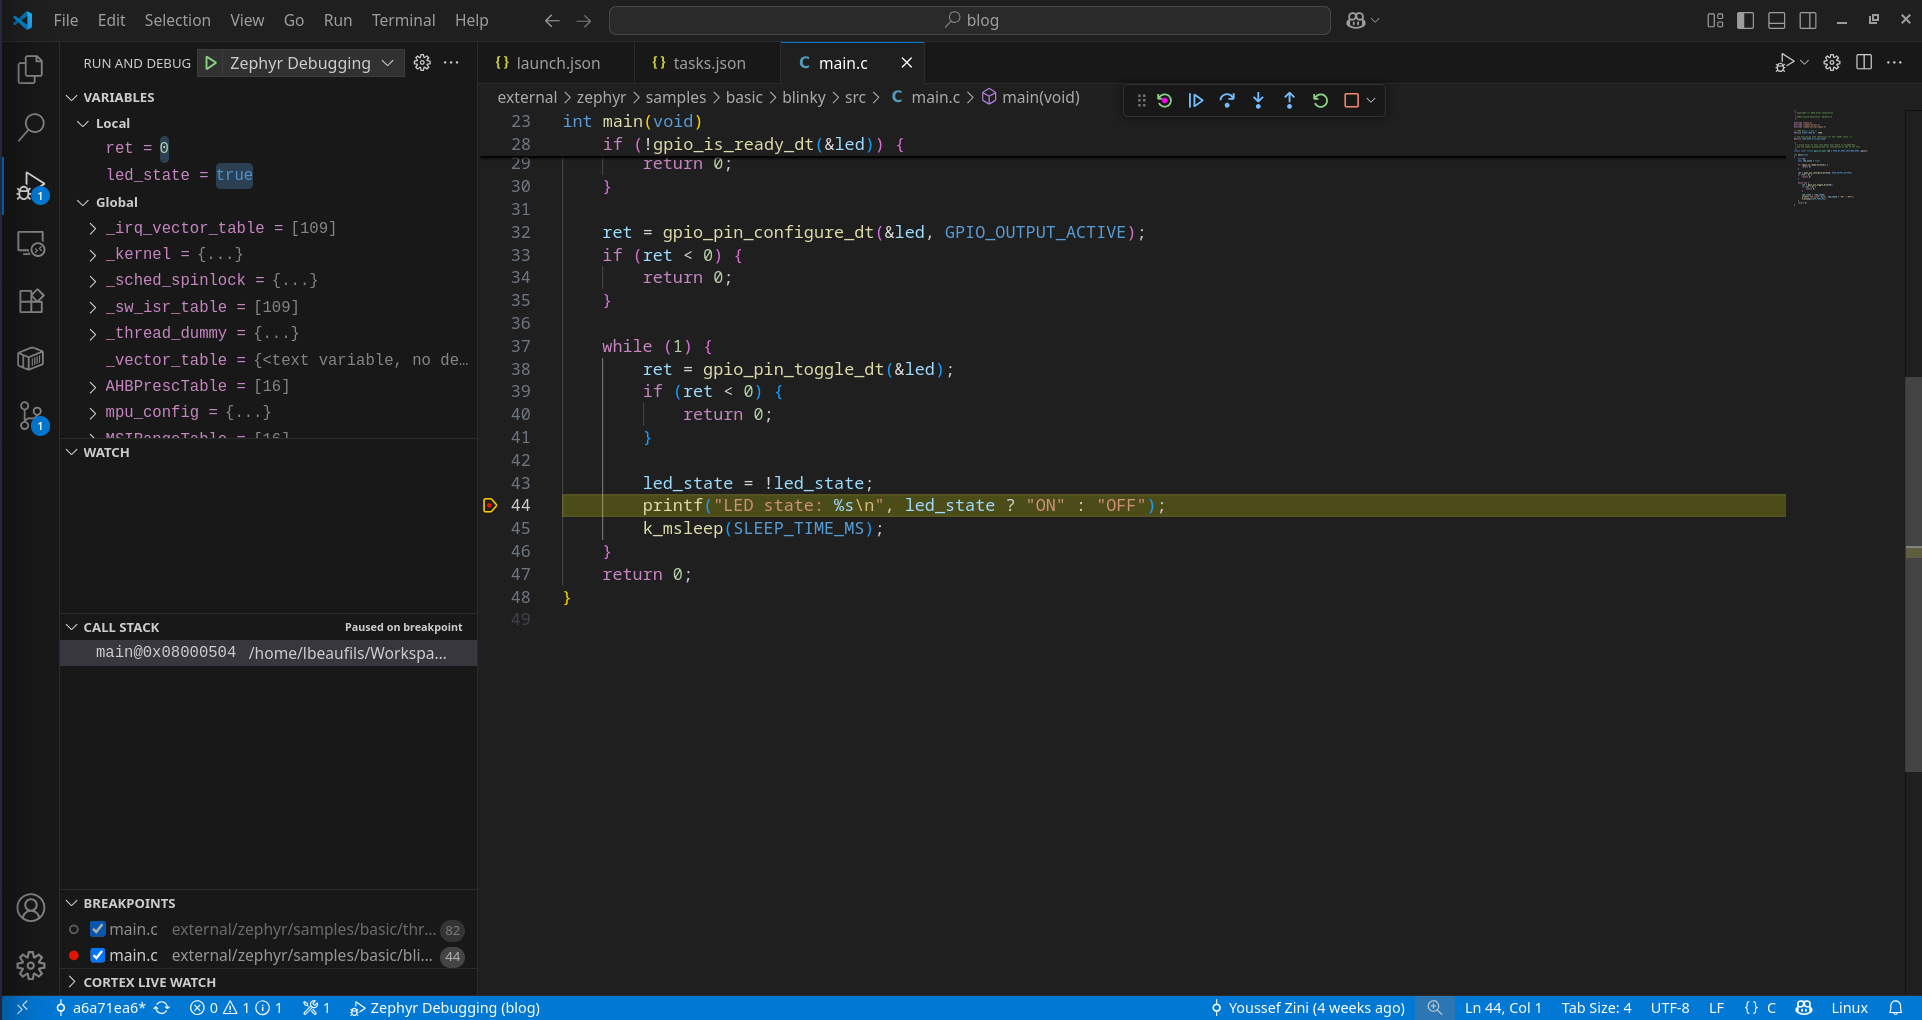
The VSCode debugging session is now ready to be launched. You can add some breakpoints to your code and try running the debug session by pressing F5 or selecting the session by pressing Ctrl+Shift+D and clicking on the green play button.
Special case: Attach debugger to running target
Sometimes, target cannot support a reset when starting a debugging session.
We have dealt with this behavior when supporting the Cortex-M33 of the STM32MP2 board.
NOTE : When we attach the debugger, the target is already running, so we cannot have debugging from the very beginning of the code execution.
Thus, the VSCode configuration has been slightly changed to attach the debugger to the running target instead of reset and run the code. In the tasks.json file, the West Debugserver task is updated as follows:
json
{
"label": "West Debugserver",
"type": "shell",
"command": "west",
"args": [
"debugserver",
"-r",
"openocd",
"--no-init",
"--cmd-reset-halt",
"''",
],
"problemMatcher": {
"pattern": {
"regexp": "^(Info |Warn |Error):(.*)$",
"severity": 1,
"message": 2
},
"background": {
"activeOnStart": true,
"beginsPattern": "^Open On-Chip Debugger.*",
"endsPattern": ".*watchpoints.*",
},
},
"isBackground": true,"runOptions": {
"instanceLimit": 1,
"instancePolicy": "terminateOldest"
},
"presentation": {
"reveal": "silent",
"close": true,
}
},
Only the args parameter is updated to ask the west debugserver to not reset the target when launching the task. Accordingly, the launch.json file is also modified to permit VSCode to attach the debugger:
json
{
"name": "Attach Zephyr Debugging",
"executable": "${workspaceFolder}/build/zephyr/zephyr.elf",
"request": "attach",
"type": "cortex-debug",
"runToEntryPoint": "main",
"servertype": "external",
"gdbPath": "/opt/sdk-0.17.0/arm-zephyr-eabi/bin/arm-zephyr-eabi-gdb",
"gdbTarget": "localhost:3334",
"device": "STM32MP2",
"preLaunchTask": "West Debugserver",
"postDebugTask": "Stop Debugserver",
},
The request parameter is updated to attach the debugger.
Also the gdb port is set to 3334, because the stm32mp2 SoC has multiple architecture, so the debugserver set by default the Cortex-M33 to the 3334.
Conclusion
As you can see, setting up a debug environment for Zephyr development is trivial, thanks to the tools provided by the RTOS and the full-featured VSCode extension Cortex-Debug.
Feel free to use the configuration for running or attaching a debug session!
Find the config on GitHub : Main branch