[L’introduction est en français, le reste du texte en anglais]
Notre précédent article traitait des bonnes pratiques nécessaires à la mise en place de Linux RT et de son logiciel applicatif. Celui ci présente un cas concret dans un contexte industriel. Il met en oeuvre une mesure des performances sur un matériel dédié.
A Practical Demonstration
SFL performed tests to demonstrate these principles on a custom board containing a Cirrus Logic EP9302 SoC with a single 200 MHz ARM920T core. The board is based on the Technologic Systems TS‑7260 SBC. The tests were run with a Linux 4.19.142 kernel under Buildroot 2020.02.3, both of which SFL has considerable experience with.
The Test Application
A simple application was written to test the performance of the EP9302‑based system when performing mock “work” on timer activation. High resolution timing values are captured into arrays of data during run-time, then printed in CSV format to STDOUT after the tests are complete.
The “work” performed includes digital output toggle, reading SPI data from a temperature sensor, a short usleep(), one pass of the Sieve of Eratosthenes, or a combination of any of these. Among many configurable aspects of operation, memory locking and “pre-fault” can be enabled or disabled, scheduler and priority can be modified.
If supported by the kernel, this program can optionally enable tracing during its test, enabling the use of the various FTrace utilities to analyze timing and latencies. The tracing is enabled only during the test run itself, to avoid extraneous data in the trace file.
The options of this program are shown in the help message are shown in listing 1, below.
simple-rt-app: Simple RT application

Usage: simple-rt-app [options]*

Options:
        -h or -H                    This message
        -c "comment string"         Comment string to be put in first line of output
        -e                          When target time miss occurs, retroactively shift target to "now"
        -f                          Perform digital outputs toggle during work period
        -i <iterations (dec)>       Number of iterative loops to perform (default 10)
        -l                          Do not lock all memory in RAM to optimize performance
        -m                          Do not initialize memory storage area to pre-fault pages
        -n                          Do not attempt to set schedule policy (just do the test)
        -q <priority (dec)>         Schedule priority requested (default maximum for schedule policy
        -r <policy (dec)>           Schedule policy requested (default SCHED_FIFO / 1)
        -s                          Perform usleep(1) during work period
        -t                          Perform read on "/sys/class/hwmon/hwmon0/temp1_input" during work period
        -u                          Attempt to clear, then to turn on and off kernel tracing
        -w                          Perform sieve of eratosthenes during work period
        -x <delay (nSec dec)>       Set target delay at bottom of loop (default 5000000)
        -y <increment (nSec dec)>   Set target delay increase on each loop (default 0)
        -z <max diff (uSec dec)>    Terminate run if DiffTimeFromTarget exceeds this value (default 0->disabled)

Notes:
    1. Data is silently collected first, then all output to STDOUT in CSV format,
       intended for spreadsheet analysis.
    2. Some defined schedule priority values for "-r" option:
         SCHED_OTHER    = 0, minimum priority   0, maximum priority   0
         SCHED_FIFO     = 1, minimum priority   1, maximum priority  99
         SCHED_RR       = 2, minimum priority   1, maximum priority  99
    3. On this machine, sizeof(int) = 4, sizeof(int *) = 4.
Listing 1: Help Message of simple-rt-app
Work: Digital Output Toggle
If enabled, three digital outputs are used to indicate Work Active, clock_nanosleep() Active, and No Sleep:
- The Work Active output is driven high at the start of work, and low at the end of work.
- The clock_nanosleep() Active output is driven high just before the call to clock_nanosleep(), and low upon return from that call.
- The No Sleep output is driven for a short high period, if the time comes to perform a clock_nanosleep(), but cannot because the target time has already passed.
Work: Reading SPI
If enabled, a temperature reading is performed by reading the special file /sys/class/hwmon/hwmon0/temp1_input is performed during the work period. The file is left open for read, so an lseek() is performed to rewind to the beginning each time.
Work: Taking a usleep()
If enabled, a usleep(1) is performed during the work period.
Work: Sieve of Eratosthenes
If enabled, one pass of a Sieve of Eratosthenes is performed on the numbers 2 to 100,000. On the EP9302-based target, the Sieve of Eratosthenes was very burdensome, so was not used for this testing.
Using an Oscilloscope
Toggling a GPIO output port is a lightweight activity and provides the ability to monitor operation using an oscilloscope. An oscilloscope cannot show precise cycle-to-cycle variation, but can be very interesting to see the timing variation in real-time. A classic analog oscilloscope, MSO, DPO or equivalent with accumulated sample display, can provide a gross indication of timing variability.
Performing Tracing
It takes a bit of setup to perform tracing, although once it is mastered, it can readily be scripted through interaction with files in /sys/kernel/debug/tracing. For example, this enables tracing of every process wakeup event in the kernel:
echo « 1 » >/sys/kernel/debug/tracing/events/sched/sched_wakeup/enable
The available options vary with the kernel build. Special files in /sys/kernel/debug/tracing, when dumped to the terminal, provide lists of available tracer options.
Trace Output
FTrace output is provided in a binary format for KernelShark interpretation, or a text-based format for viewing in a text editor. Both formats have their place – the binary format is more compact and the KernelShark view can be amazing, but the text format can be annotated by hand if necessary, or, with a bit of processing, loaded into a spreadsheet for more in-depth analysis.
FTrace can also provide a “function graph” text output. In practice, this feature consumed more resources than the test platform could provide, and always caused a kernel fault, so we did not use this feature
Outputs are read directly by copying data from the sysfs filesystem.
The tracecmd extract command extracts the binary data from the kernel and creates a binary data file for analysis.
KernelShark
KernelShark is intended to be a graphical FTrace analysis tool, similar to the role of WireShark for network protocol analysis. Using KernelShark to analyze the real-time scheduler gives a good outline of its use. An example display is shown in figure 1.
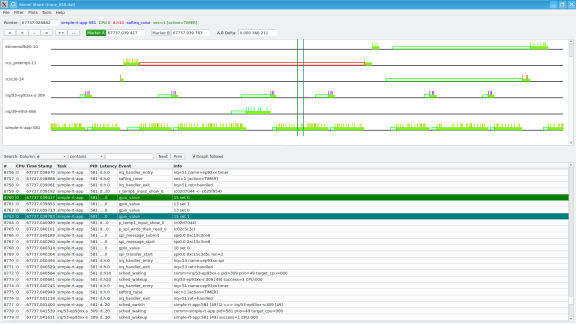
Figure 1: KernelShark Examining an FTrace Capture
Adding Extra Processing Load for Realism
A utility called stress-ng is used to add processing load to a system to simulate real-world application. Many systems will operate satisfactorily when the processor load is light, but slip in operation when other functions like communications or logging are activated. It’s appropriate to load down the processor during our tests, to see how the system will perform.
Testing Non-Real-Time versus Real-Time
SFL generated two kernels using as close to the same options as possible, but with one having the RT_PREEMPT option enabled, the other having the option disabled. We performed multiple test runs with various parameters, capturing its data and exporting it to a workstation for analysis. Listing 2 shows an example of the commands used.
stress-ng --cpu 1 &
# to ensure that stress-ng gets started
sleep 5
simple-rt-app -t -i 1000 -c "test comment" >ts_file.csv
tftp -p -l ts_file.csv -r analysis/ts_file.csv  workstation
Listing 2: Script to run Simple Test
Comparison Results
The results of table 1 are typical of the statistics that simple-rt-app provided.
| Work Duration (uSec) | Overall Loop Time (uSec) | Top Of Loop Timing Error (uSec) |
| Non-Real-Time | Real-Time | Non-Real-Time | Real-Time | Non-Real-Time | Real-Time |
Minimum | 604 | 858 | 3727 | 4754 | 351 | 294 |
Maximum | 1560 | 1990 | 6271 | 5390 | 1642 | 546 |
Average | 837 | 1051 | 5000 | 5000 | 400 | 360 |
Standard Deviation | 195.8 | 193.8 | 93.0 | 75.5 | 61.7 | 41.9 |
Table 1: Non-Real-Time and Real-Time Linux Results |
The table indicates that although the “work” duration (SPI read) took longer in the Real-Time Linux system, the variation was slightly less, and both overall loop time and timing error were substantially more consistent for the real-time kernel.
When displayed graphically, the result is much more striking, per the images below. It is clear that the Real-Time Linux system has more ongoing variation, but fewer big “misses”.
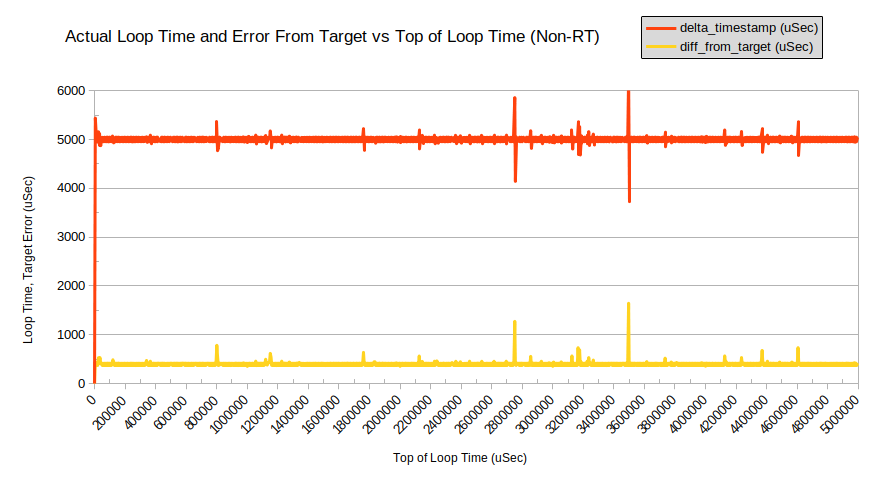
Figure 2: Non-Real-Time Linux doing SPI Read as Work (1,000 iterations, 5,000 uSec per loop)
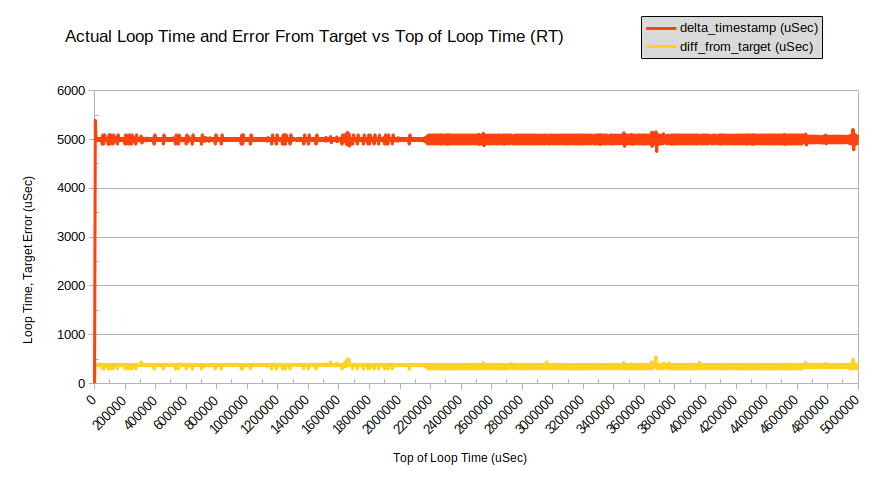
Figure 3: Real-Time Linux doing SPI Read as Work (1,000 iterations, 5,000 uSec per loop)
Performing FTrace on Real-Time Program
Next, the Real-Time Kernel was rebuilt with support for FTrace and tests were run again, to have a closer look at the various latencies and jitter in operation.
Initial Attempts to Perform Tracing
Initial FTrace testing used the trace-cmd program as a wrapper as is suggested in the literature, but this consistently caused the target to crash. Even narrowing to specific functions like “wakeup” caused the same crash:
trace-cmd record -p wakeup ./simple-rt-app -f -t -c "test comment" >ts_file.csv
Listing 3: Running FTrace with echo Commands (Result: kernel crash)
When tracing was activated using echo commands, it worked, but captured far too much data:
echo 1 >/sys/kernel/debug/tracing/events/sched/sched_wakeup/enable
# this clears the trace buffer
echo >/sys/kernel/debug/tracing/trace
echo 1 >/sys/kernel/debug/tracing/tracing_on
./simple-rt-app -f -t -c "test comment" >ts_file.csv
echo 0 >/sys/kernel/debug/tracing/tracing_on
cat /sys/kernel/debug/tracing/trace
Listing 4: Running FTrace with echo Commands (Result: works but far too much data)
Internal Trace Clear, Start and Stop
The simple-rt-app was modified to perform the equivalent to the echo commands, clearing the buffer initially, and turning on and off the tracing only when desired (during the test loop). This was most successful:
echo "1" >/sys/kernel/debug/tracing/events/sched/sched_wakeup/enable
echo "1" >/sys/kernel/debug/tracing/events/sched/sched_wakeup_new/enable
echo "1" >/sys/kernel/debug/tracing/events/sched/sched_waking/enable
echo "1" >/sys/kernel/debug/tracing/events/syscalls/sys_enter_clock_nanosleep/enable
echo "1" >/sys/kernel/debug/tracing/events/syscalls/sys_exit_clock_nanosleep/enable
echo "1" >/sys/kernel/debug/tracing/events/syscalls/sys_enter_nanosleep/enable
echo "1" >/sys/kernel/debug/tracing/events/syscalls/sys_exit_nanosleep/enable
echo "1" >/sys/kernel/debug/tracing/events/spi/spi_transfer_stop/enable
echo "1" >/sys/kernel/debug/tracing/events/spi/spi_transfer_start/enable
echo "1" >/sys/kernel/debug/tracing/events/spi/spi_message_done/enable
echo "1" >/sys/kernel/debug/tracing/events/spi/spi_message_start/enable
echo "1" >/sys/kernel/debug/tracing/events/spi/spi_message_submit/enable
echo "1" >/sys/kernel/debug/tracing/events/spi/spi_controller_busy/enable
echo "1" >/sys/kernel/debug/tracing/events/spi/spi_controller_idle/enable
echo "1" >/sys/kernel/debug/tracing/events/irq/irq_handler_exit/enable
echo "1" >/sys/kernel/debug/tracing/events/irq/irq_handler_entry/enable
stress-ng --cpu 1 &
# to ensure that stress-ng gets started
sleep 5
simple-rt-app -i 1000 -q 1 -f -t -u -c "Test comment" >ts_file.csv
cat /sys/kernel/debug/tracing/trace >trace.txt
trace-cmd extract
tftp -p -l trace.dat -r analysis/trace.dat  workstation
tftp -p -l trace.txt -r analysis/trace.txt  workstation
tftp -p -l ts_file.csv -r analysis/ts_file.csv  workstation
Listing 5: Script to Run FTrace (Result: successful)
Each test produced three analysis files:
- ts_file.csv: a text file generated by the test program itself, containing the time measurements from each iteration of the test loop, and some statistics related to those measurements. The format was chosen for easy import into a spreadsheet for further analysis and graphing.
- trace.txt: a human-readable trace file generated by the FTrace system of the kernel. This could be viewed in a text editor.
- trace.dat: a binary trace file generated by the FTrace system, for analysis with KernelShark.
For Future Investigation
It appears that the Observer Effect affected the results of our FTrace – when performing a trace, occasional glitches appear in the timing of the loop. Future research will include further investigation into these glitches, and how to avoid them.
What Next?
There are many instances where Real-Time Linux with a few real-time processes would help maintain system performance, making it possible to upgrade an old SBC to a modern, more secure Linux.
Some cases require more extensive work. One recent application involves coordination of multiple processor cores, very high sustained network data bandwidth, and high frame-rate video processing. Here, Real-Time Linux will provide significant benefit to this application, but the system must be carefully configured. Special drivers or custom kernel modifications may be required to meet all the requirements. SFL has the skill and the knowledge to investigate these challenges, make recommendations, and address the code changes.
Future articles will provide further insight into the ways that Real-Time Linux can be adapted to meet the needs of embedded systems.
Summary
Linux can be used successfully to breathe new life into old systems, providing modern reliability and security to older, limited embedded computers. With care and planning, Real-Time Linux can restore the required performance to a system that would otherwise be too limited to function satisfactorily. Tracing and testing can ensure that functional requirements are met. Savoir-faire Linux can provide you with the support to ensure successful deployment of Linux in your application, whatever that application may be.